A) Panel a)
B) Panel b)
C) Panel c)
D) Both b) and c) are correct.
F) A) and C)
Correct Answer

verified
Correct Answer
verified
Multiple Choice
Figure 10-2. The graph depicts the market for plastic. 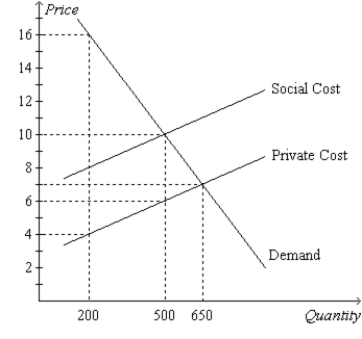 -Refer to Figure 10-2. A benevolent social planner would like to see
A) 200 units of plastic produced.
B) 500 units of plastic produced.
C) 650 units of plastic produced.
D) more than 650 units of plastic produced.
F) All of the above
Correct Answer

verified
Correct Answer
verified
Multiple Choice
Table 10-1
The following table shows the private value, private cost, and external cost for various quantities of output in a market.
 -Refer to Table 10-1. What is the socially-optimal quantity of output in this market?
A) 1 unit
B) 2 units
C) 3 units
D) 4 units
F) A) and D)
Correct Answer

verified
Correct Answer
verified
True/False
Patent protection is one way to deal with technology spillovers.
B) False
Correct Answer

verified
Correct Answer
verified
Multiple Choice
A local manufacturing plant that emitted sulfur dioxide was forced to stop production because it did not comply with local clean air standards. This decision provides an example of
A) a direct regulation of an externality.
B) corrective taxes.
C) a Coase theorem solution to an externality.
D) the misuse of a subsidy.
F) B) and D)
Correct Answer

verified
Correct Answer
verified
Multiple Choice
Technology spillover occurs when
A) a firm passes the high costs of technical research on to society through higher prices.
B) a firm's research yields technical knowledge that is used by society as a whole.
C) the government subsidizes firms engaged in high-tech research.
D) copyright laws prohibit firms from profiting from the research of others.
F) None of the above
Correct Answer

verified
Correct Answer
verified
Multiple Choice
Which of the following statements is not correct?
A) Government policies may improve the market's allocation of resources when negative externalities are present.
B) Government policies may improve the market's allocation of resources when positive externalities are present.
C) A positive externality is an example of a market failure.
D) Without government intervention, the market will tend to undersupply products that produce negative externalities.
F) B) and D)
Correct Answer

verified
Correct Answer
verified
Multiple Choice
Figure 10-1 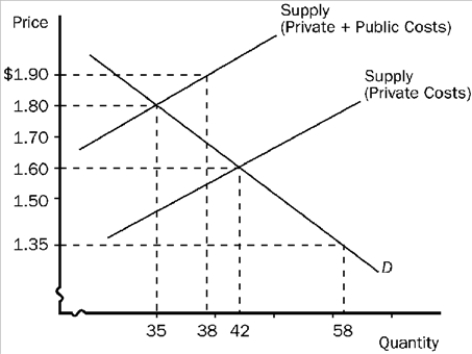 -Refer to Figure 10-1. This graph represents the tobacco industry. Without any government intervention, the equilibrium price and quantity are
A) $1.90 and 38 units, respectively.
B) $1.80 and 35 units, respectively.
C) $1.60 and 42 units, respectively.
D) $1.35 and 58 units, respectively.
F) A) and B)
Correct Answer

verified
Correct Answer
verified
Multiple Choice
Two firms, A and B, each currently emit 100 tons of chemicals into the air. The government has decided to reduce the pollution and from now on will require a pollution permit for each ton of pollution emitted into the air. The government gives each firm 40 pollution permits, which it can either use or sell to the other firm. It costs Firm A $200 for each ton of pollution that it eliminates before it is emitted into the air, and it costs Firm B $100 for each ton of pollution that it eliminates before it is emitted into the air. It is likely that
A) Firm A will buy all of Firm B's pollution permits. Each one will cost between $100 and $200.
B) Firm B will buy all of Firm A's pollution permits. Each one will cost between $100 and $200.
C) Both firms will use their own pollution permits.
D) Firm A will buy some of Firm B's pollution permits. Each one will cost less than $100.
F) A) and D)
Correct Answer

verified
Correct Answer
verified
Multiple Choice
Figure 10-4 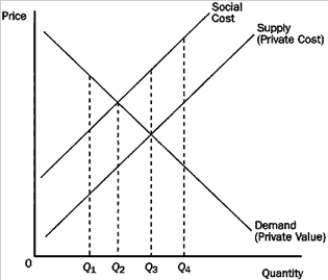 -Refer to Figure 10-4. This market is characterized by
A) government intervention.
B) a positive externality.
C) a negative externality.
D) None of the above is correct.
F) B) and D)
Correct Answer

verified
Correct Answer
verified
Multiple Choice
Figure 10-9
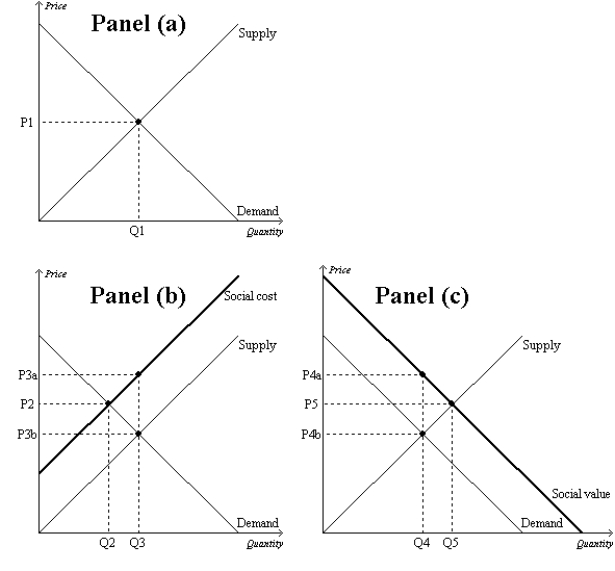 -Refer to Figure 10-9, Panel c) . The market equilibrium quantity is
A) Q4, which is the socially optimal quantity.
B) Q5, which is the socially optimal quantity.
C) Q4, and the socially optimal quantity is Q5.
D) Q5, and the socially optimal quantity is Q4.
F) None of the above
Correct Answer

verified
Correct Answer
verified
Multiple Choice
Figure 10-9
 -Refer to Figure 10-9, Panel b) and Panel c) . The overuse of antibiotics leads to the development of antibiotic- resistant diseases. Therefore, the external cost of antibiotic overuse is represented by
A) Q3 - Q2.
B) Q5 - Q4.
C) P3a - P3b.
D) P4a - P4b.
F) B) and D)
Correct Answer

verified
Correct Answer
verified
Multiple Choice
Private markets fail to reach a socially optimal equilibrium when positive externalities are present because the
A) private benefit equals the social benefit at the private market solution.
B) private cost exceeds the private benefit at the private market solution.
C) social value exceeds the private value at the private market solution.
D) private cost exceeds the social benefit at the private market solution.
F) B) and D)
Correct Answer

verified
Correct Answer
verified
Multiple Choice
When one firm sells its pollution permit to another firm,
A) both firms benefit.
B) the total amount of pollution remains the same.
C) the total amount of pollution decreases.
D) Both a and b are correct.
F) A) and B)
Correct Answer

verified
Correct Answer
verified
Multiple Choice
A paper plant produces water pollution during the production process. If the government forces the plant to internalize the negative externality, then the
A) supply curve for paper would shift to the right.
B) supply curve for paper would shift to the left.
C) demand curve for paper would shift to the right.
D) demand curve for paper would shift to the left.
F) A) and B)
Correct Answer

verified
Correct Answer
verified
Multiple Choice
In a certain city, the local government regulates the destruction of historic buildings and provides tax breaks to owners of historic buildings who restore them. These government policies
A) reflect the fact that restored historic buildings convey a positive externality.
B) reflect the fact that the destruction of historic buildings conveys a positive externality.
C) are likely to worsen the market failure that is associated with historic buildings and the restoration of such buildings.
D) are likely to decrease the well-being of society as a whole.
F) All of the above
Correct Answer

verified
Correct Answer
verified
Multiple Choice
Which of the following policies is not an example of a command-and-control policy?
A) subsidies
B) Pigovian taxes
C) tradable pollution permits
D) None of the above is an example of a command-and-control policy.
F) C) and D)
Correct Answer

verified
Correct Answer
verified
Multiple Choice
Figure 10-7 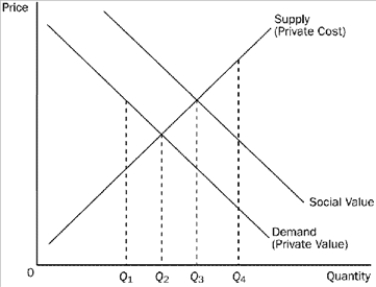 -Refer to Figure 10-7. Which quantity represents the social optimum for this market?
A) Q1.
B) Q2.
C) Q3.
D) Q4.
F) A) and B)
Correct Answer

verified
Correct Answer
verified
True/False
A technology spillover is a type of negative externality.
B) False
Correct Answer

verified
Correct Answer
verified
Multiple Choice
Table 10-1
The following table shows the private value, private cost, and external cost for various quantities of output in a market.
 -Refer to Table 10-1. What is the equilibrium quantity of output in the market?
A) 2 units
B) 3 units
C) 4 units
D) 5 units
F) A) and D)
Correct Answer

verified
Correct Answer
verified
Showing 201 - 220 of 522
Related Exams